In times of volatility, it is critical to know how to interpret aggregated cost of funds data and correctly understand the pricing marketplace today. You may be familiar with Mark Twain’s opinion of statistics — “There are three kinds of lies: Lies, damned lies and statistics.” With respect to Twain’s observation, we need to be sure we are not deceived (however unintentionally) by recent statistics. What does recent peer data tell us about cost of funds and rate survey data?
In data from the FFIEC for third quarter 2022, we see that the median of total interest-bearing deposits is 0.45 percent and the trimmed average is 0.49 percent (see table below). So can we conclude from this that the addition of non-interest bearing deposits would drive the cost of funds for all deposits in the quarter to something less than these two levels? 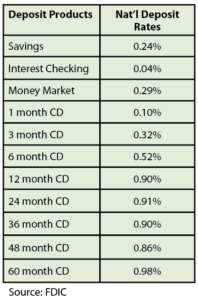
Meanwhile, the data reported by the FDIC in the quarterly report states that the cost of funds was actually significantly higher than those metrics for the quarter. It shows that average funding costs increased 38 basis points from second quarter 2022, to 0.64 percent in the third quarter (not what we would have expected from the UBPR data). That number was 0.17 percent in 2021.
In third quarter 2022, the range of costs spans from 0.36 percent for institutions with less than $100 million in assets to 0.65 percent for those with more than $250 billion. A year prior, the opposite was the case, with the smallest institutions reporting 0.36 percent and the biggest 0.10 percent. The largest banks were driving down the cost of funds compared to peer median in 2021 and now they are driving up that same cost of funds.
When we drill deeper into the highest rates on the UBPR we see that time deposits had a median yield of 0.79 percent and a trimmed average of 0.82 percent. However, when the actual data for all banks is analyzed by taking the total CD interest expense for the quarter divided by the average CD balance for all banks for the quarter, we find that in the third quarter of 2022, the actual average rate paid to owners of time deposits was 1.43 percent. Therefore, it would be a distortion to believe that your bank is somehow missing the mark if you were above 0.79 percent when anything below 1.43 percent would have been lower than industry cost of funds in this time deposit category.
The differences between median and average cost are not consistent over time. We should not conclude that there is a natural proportionality to the deviation between reported median and actual industry yields (see table of historical median yield on CDs compared to the average paid on all CDs below).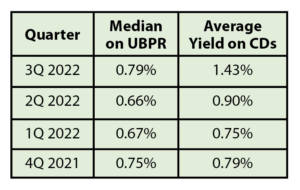
Of course, this is happening because simply averaging rates without consideration of the related volumes produces the distorted impact that Twain could have been referring to. With half of banks having a yield on total interest-bearing deposits less than 0.45 percent, this does not mean that the average rate on deposits was 0.45 percent.
This extends beyond aggregating industry results. The accumulation of survey data is also prone to misinterpretation. We find that the FDIC reports average deposit offering rates. The most recent report at the time of this writing displays the following data as of Nov. 21, 2022:
We have shown that for the months of July through September including all types of deposits, the cost of funds was 0.64 percent and the cost of time deposits was 1.43 percent. Recognizing that the level of interest rates continued to increase between the third quarter and this Nov. 21 survey report, it is surprising to observe that the average reported industry offerings are still substantially less than what the industry was paying for term deposits back in the third quarter.
Is there a data integrity issue? I don’t believe so. Instead, we must understand the way in which this type of data is aggregated and reported and how market response shapes the reality of cost of funds. With rate survey data we must recognize that survey data does not often appropriately address the relevance of each rate offered.
You would never submit an average yield report on your portfolio of assets or liabilities to your executive and management team that was not weighted by the balances associated with each rate. Yet, that is exactly what is done in rate survey reports. Sometimes there are attempts to weight. The FDIC weights its report by the total deposits of the institution even though the particular product rate quoted may not be represented equivalently to the scale of the bank. The S&P average rate surveys weight the offerings of each institution by the number of branches with the offerings. Additional distortion can be due to the fact that generally the off-tenor maturities are ignored even though those are the ones that often garner a large portion of the marketplace response. This all contributes to the conclusion that in times like these you may believe that your rates are higher than the average or comparable to average when in fact they are not as competitive as a casual assessment of industry data may suggest.
Pricing has always been a mission critical function of every financial institution. With the dynamics of the current interest rate environment the stakes are high. Every pricing manager must understand the context of the environment and have a clear assessment of the consequences of each of their pricing alternatives. Understanding the likely consequences of alternative pricing levels relative to competition has never been more important.
Neil Stanley is founder and CEO at The CorePoint. You can learn more about the interpretation of rate survey data here: https://youtu.be/eaxUk0wJ1lU.